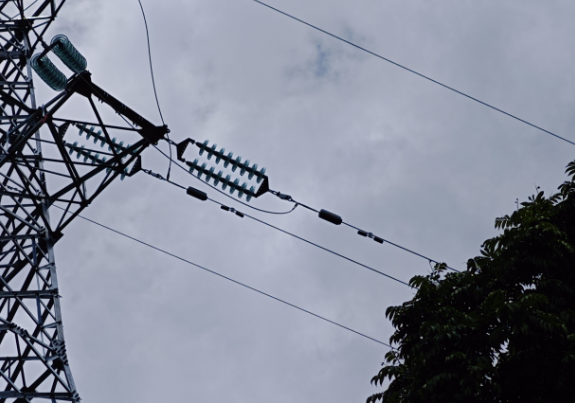
Summer heatwaves sweep through cities, causing air conditioning loads to surge; winter cold snaps strike suddenly, pushing heating electricity consumption to its limits. Whenever these peak electricity demands arrive, it is also the most vulnerable moment for the transmission system. In distant mountainous regions, a high-voltage line trips due to lightning strikes; on the outskirts of cities, a cable somewhere fails due to long-term aging and insulation issues—these seemingly localized faults can trigger chain reactions, leading to widespread power outages and causing billions in economic losses.
Traditional power transmission fault detection is like searching for a needle in a haystack. Maintenance crews must drive hundreds of kilometers, traversing mountains and valleys to inspect lines;Dingxin Smart Technology's "Transmission Fault Visualization Wizard" enables control centers to overcome reliance on stacks of two-dimensional drawings and tabular data, making it difficult to quickly pinpoint the root cause of issues; data silos between different systems turn fault analysis into hindsight.
The Transmission Fault Visualization Wizard is not merely a data display tool, but an intelligent diagnostic platform integrating artificial intelligence, big data analytics, and 3D visualization technology. Its core capabilities are built upon four major technological pillars:
1. The high-precision 3D digital twin system utilizes satellite remote sensing, drone aerial photography, and laser scanning data to construct millimeter-level detailed models of the transmission network. Every tower, every line segment, and even every insulator possesses its own digital counterpart, providing real-time mapping of the operational status of physical equipment.
2. The multi-source data fusion analysis engine breaks down data silos between existing systems, integrating SCADA systems, online monitoring devices, meteorological information, geographic environment data, and even satellite imagery for comprehensive analysis. This creates a holistic perception capability for the transmission network.
3. The AI fault diagnosis model, based on deep learning algorithms, has established a diagnostic knowledge base covering 17 major fault categories—including lightning strikes, wind deflection, soiling flashovers, and external damage—by learning from historical fault cases. It can rapidly identify fault types and pinpoint fault locations.
4. The augmented reality interface utilizes a game-grade rendering engine to deliver a multidimensional, multi-scale visualization experience. Operations personnel can "dive into" the interior of cables to inspect insulation degradation, or "soar to 10,000 meters" to survey the operational status of the entire regional power grid.
Based on spatio-temporal big data and deep learning algorithms, the system will be able to predict potential grid failures within the next 72 hours—identifying sections prone to tree-related outages under specific weather conditions, equipment likely to develop defects due to prolonged operation, and even simulating vulnerabilities in the grid during extreme natural disasters.
A further vision is to build an "autonomous grid" system. When abnormal conditions are detected, the system will not only issue alerts but also automatically generate response plans. After human confirmation, it will execute control operations, achieving a closed-loop autonomous process from "perception-analysis-decision-execution."


